
Coffee Price Forecast Impact on Roasters: Cost Pass-Through, Risk Management & Menu Pricing Playbook
TL;DR: Rising coffee futures lift green‑bean costs directly; small‑batch roasters — lacking volume leverage and holding slower‑turning stock — feel the squeeze hardest. Forward contracts, call options, multi‑origin sourcing, dynamic menu pricing and transparent cost storytelling together buffer volatility while protecting specialty flavor integrity.
Picture this: dawn light filters through the roastery as green beans tumble in the drum, releasing first a grassy whisper, then caramel, nut, and floral notes in layered succession. That moment of flavor carries more than terroir and heat — it holds a quiet negotiation spanning oceans, from the electronic board of the ICE exchange in New York to a cooperative buying station in Yunnan or Ethiopia, and finally into your roast log. The coffee price forecast impact on roasters is never just a numbers game; it decides whether cash flow can fund the next micro‑lot Geisha, whether the pour‑over on your menu can still tell the origin’s full story. As we mapped in the Coffee Price Forecast 2026: A Three-Factor Model and Monthly Range Outlook, forecasts are probability charts, not crystal balls — the real voyage depends on the cost cushions and flavor firewalls you build amid uncertainty.
#How Do Futures Moves Reach the Roasting Floor?
A 10‑cent swing in the ICE Arabica KC contract shifts FOB green cost by roughly $0.22/lb. For a 5‑tonne/year specialty roaster without hedging, a 50‑cent rally adds ~$11,000 in annual green spend — roughly one full‑time barista salary.

Three transmission nodes
- Origin premium amplification: When futures rise, co‑ops and exporters stack “market premium” atop “quality premium”; micro‑lot differentials often run 1.5–2× the futures move.
- Logistics & FX stacking: Every 1,000‑point rise in the FBX container index adds ~$0.05/lb freight; origin‑currency appreciation tacks on another 2–5%.
- Carry cost creep: Small roasters typically hold 4–8 weeks of stock; financing that inventory gets expensive as rates climb.
Pro tip: Build a four‑factor cost model — futures basis + origin premium + freight + FX — and refresh it weekly. It tracks real landed cost far better than watching the C‑price alone.
#Why Are Small‑Batch Roasters More Exposed?
#Asymmetric bargaining power
Large roasters buy by the container (37,500 lb) and negotiate “C‑price + fixed basis.” Small buyers purchase by pallet (~1,000 lb) or LCL, facing volatile basis quotes and high MOQs that force spot premiums.
#Cash‑flow & inventory squeeze
- Payment terms: Origins often want 30% prepayment, 70% against B/L, while cafés pay net‑30 to net‑60. The working‑capital gap widens with every cent of green‑price inflation.
- Aging risk: Stockpiling to average down costs backfires when specialty green passes its 6–12 month peak flavor window; cupping scores can drop 3–5 SCA points, eroding brand premium.
#Case snapshot: 30‑kg/batch roastery in East China
H1 2024 KC rallied from 180¢ to 230¢/lb. Unhedged, the roastery saw per‑batch green cost jump ~¥1,200 (18% of batch revenue). Two forced wholesale hikes in three months cost them two café accounts. This mirrors the market bifurcation noted in 5 Reasons Why Australian Cafés Are Taking Over the World! Also the Country Where Starbucks Failed Most — consumer‑side polarization pressures suppliers to walk the cost‑quality tightrope.
#What Hedging Tools Actually Work for Roasters?
#1. Forward contracts with importers/origins
Lock “C‑price + basis” for 6–12 months.
- Fit: >3 tonnes/year, stable single‑origin needs.
- Guardrail: Reserve 10–15% volume flexibility for quality rejects.
#2. Call options
Buy calls at budget‑cap strike; premium ~1.5–3¢/lb. Exercise if futures breach strike; walk away if they fall, losing only premium.
- Cost context: Premium ≈ 2–3 weeks warehousing — far cheaper than chasing spot highs.
#3. Multi‑origin portfolio
| Origin Mix | Price Correlation | Flavor Complement | Sourcing Difficulty |
|---|---|---|---|
| Ethiopia + Colombia + Brazil | Low (staggered harvests) | High (floral/fruit, nut/choco, balance) | Medium |
| Guatemala + Costa Rica + Panama | Medium (same hemisphere) | Medium‑high (bright acid, complex ferment) | High (micro‑lot competition) |
| Sumatra + Vietnam Robusta + Uganda | Low (different species/regions) | Low (heavy body, low acid, blend filler) | Low |
Our take: Specialty roasteries thrive on a “core origins locked + micro‑lot flexible” split — 60–70% contracted staples, 30–40% opportunistic gems.
#Which Origins React Most to Forecast Shifts?
#High sensitivity
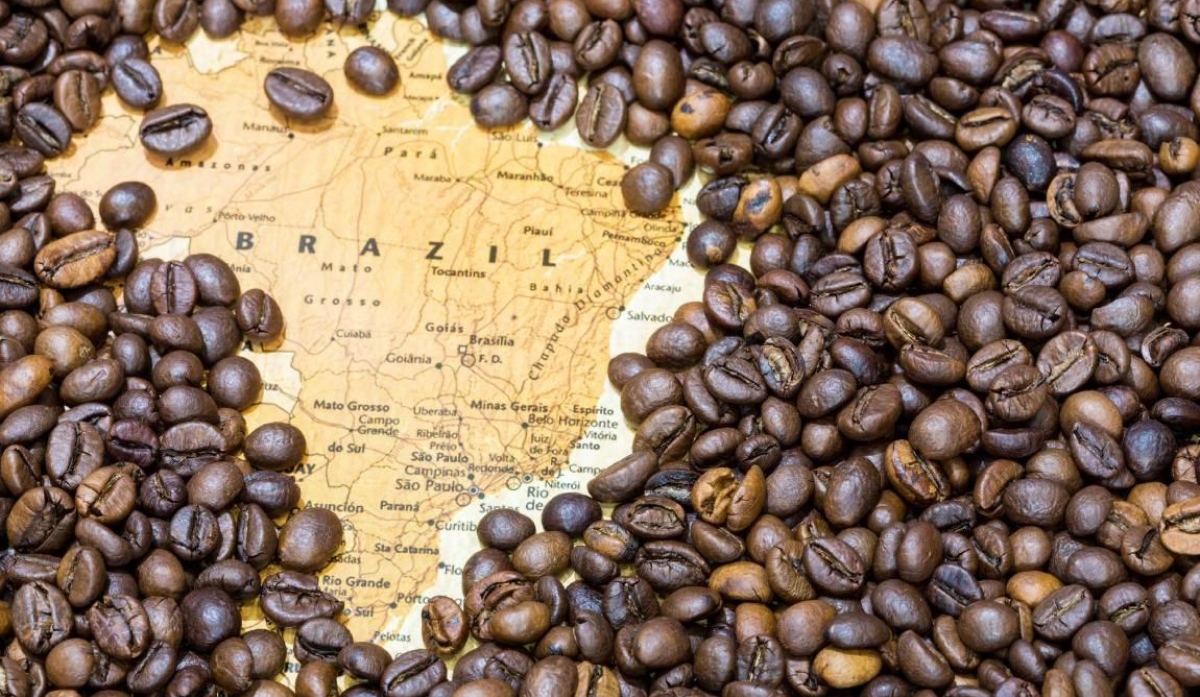
- Brazil: 35%+ of world supply; frost/drought fears move futures and basis violently.
- Vietnam: Robusta driver; weather & export policy ripple into London RC, indirectly lifting Arabica substitution demand.
#Medium sensitivity
- Colombia: Stable volumes but FX (COP/USD) and inland freight swing basis; often shows inverse basis move when futures rally.
| Honduras/Peru: Smallholder‑heavy, weak co‑op financing → spot premiums balloon on futures rallies.
#Low sensitivity / contrarian windows
- Ethiopia: ECX auction floor + gov’t minimum export price decouple spot from futures; stable periods often show “futures up, premium flat.”
- Yemen / Panama Geisha: Ultra‑micro lots priced at buyer auctions; macro futures barely register, but liquidity is near zero.
#How Do Forecasts Reshape Specialty Café Menu Pricing?
#Dynamic cost‑plus
Static “green cost × 3.5” breaks in volatility. Use a rolling 3‑month weighted average green cost as pricing floor; review quarterly.
#Tiered menu & premium narrative
| Menu Tier | Green Cost % of Retail | Pricing Anchor | Narrative Hook |
|---|---|---|---|
| Core Blend | 18–22% | Consistency, repeat volume | “Your daily golden ratio” |
| Rotating Single Origin | 25–30% | Seasonality, flavor map | “Limited‑edition terroir snapshot” |
| Micro‑lot / Auction Lot | 35–45% | Scarcity, cupping score | “Vault‑grade annual masterpiece” |
#Talk‑track example
“This Ethiopian natural Yirgacheffe came from a region hit by early rains — yields down 15%, green cost up 22%. We absorbed 10% and passed only +$0.20 per pour‑over, so you still get the full jasmine‑citrus expression.”
Transparent cost storytelling turns price hikes into trust deposits. As explored in Cafés: The Cultural Code of the Urban Third Space, the third space thrives when price signals become part of the narrative, not a barrier.
#Defensive Roast & QC Adjustments
#Roast curve tweaks for moisture drift
High‑price years often bring early picks or rushed drying → green moisture outside the 10.5–11.5% sweet spot.
- >12% moisture: Extend drying phase 30–45 sec, drop charge temp 5–10°C to avoid under‑caramelization.
- <10% moisture: Shorten drying, raise charge temp to prevent runaway roast.
#Cupping frequency & SCA score gates
Build a cost‑flavor decision matrix:
- ≥86 SCA: Keep as single origin, absorb cost.
- 84–85.75: Demote to blend component.
- <84: Drop; source replacement with matching flavor profile.
#Closing: Ritual Over Volatility
Price forecasts are probability maps, not crystal balls. We cannot steer the C‑market, but we can choose: forward contracts for cash‑flow cushion, origin diversity for flavor firewalls, honest pricing so guests taste the terroir and the integrity behind every cup.
Next time you log jasmine notes on that Ethiopian cupping sheet, or nudge the Brazil percentage in your house blend by 2%, remember: market swings are the market breathing; flavor constancy is our promise to the land, the farmer, and every person who lifts the cup.
Your next steps
- This week: spin up the four‑factor cost spreadsheet with live futures feed and importer quotes.
- Ask two importers for 6‑month forward basis quotes; compare against call‑option premiums.
- Audit your menu into the three tiers above; tag each SKU with green‑cost % and narrative hook.
#FAQ
#If futures jump 50¢/lb, how much does a small roaster’s per‑cup cost rise?
At 15 g dose, 15% roast loss, green cost rises ~$0.12/cup (≈¥0.85). With origin premium amplification and freight, real‑world impact often lands at ¥1.2–1.5/cup.
#Can a sub‑1‑tonne/year roastery use options?
Standard ICE options are 37,500 lb — too large. Look for brokers offering mini‑contracts or OTC structured notes, or ask your importer to embed a forward hedge in your purchase agreement.
#Which origin shows the lowest correlation with futures — a natural hedge?
Ethiopia’s ECX system and government floor price keep spot/futures correlation often below 0.4, while delivering distinctive flavor profiles ideal for specialty diversification.
#How can a specialty café raise prices without losing traffic?
Run a three‑tier menu: hold core blend steady, nudge rotating singles, premium‑price micro‑lots. Pair each move with origin‑story transparency. Cafés that communicate openly see 12–18% better average‑ticket recovery after three months versus silent hikers.
#How to spot green quality damaged by price‑driven early harvest?
Cup for grassy/under‑ripe dry aroma, sharp acidity lacking sweet balance, short woody finish. Confirm with moisture >12.5% and water activity >0.65 — both signal accelerated aging risk.


Comments