
2024 China City Coffee Development Report: 10 Decision Charts, 3 Pitfall Checklists & City-Tier Site Selection Model
TL;DR: The 2024 China City Coffee Development Report reveals Shanghai leads in per-capita cafe density; Luckin, Cotti & Starbucks control 62% of chain outlets; new-tier cities like Chongqing and Xi'an grow 25%+ YoY; yet mainland per-capita consumption is only 0.11 kg vs. a 1.3 kg global average. This article distills the 200+ page report into 10 decision charts, 3 startup pitfall checklists, and a city-tier site-selection model, plus a compliant PDF download link.
#2024 China City Coffee Development Report: Key Metrics at a Glance
The study covers 300+ prefecture-level cities, 450,000+ store POIs, and 120,000 consumer surveys. Headline numbers:
- Total urban coffee shops surpass 200,000, up 18.7% YoY
- Chain outlets account for 67% of stores; median daily volume 320 cups/store
- Per-capita annual consumption reaches 0.11 kg, up 0.02 kg from 2023
- Specialty coffee share rises from 4.2% to 6.8%, yet median store revenue still trails chain commodities
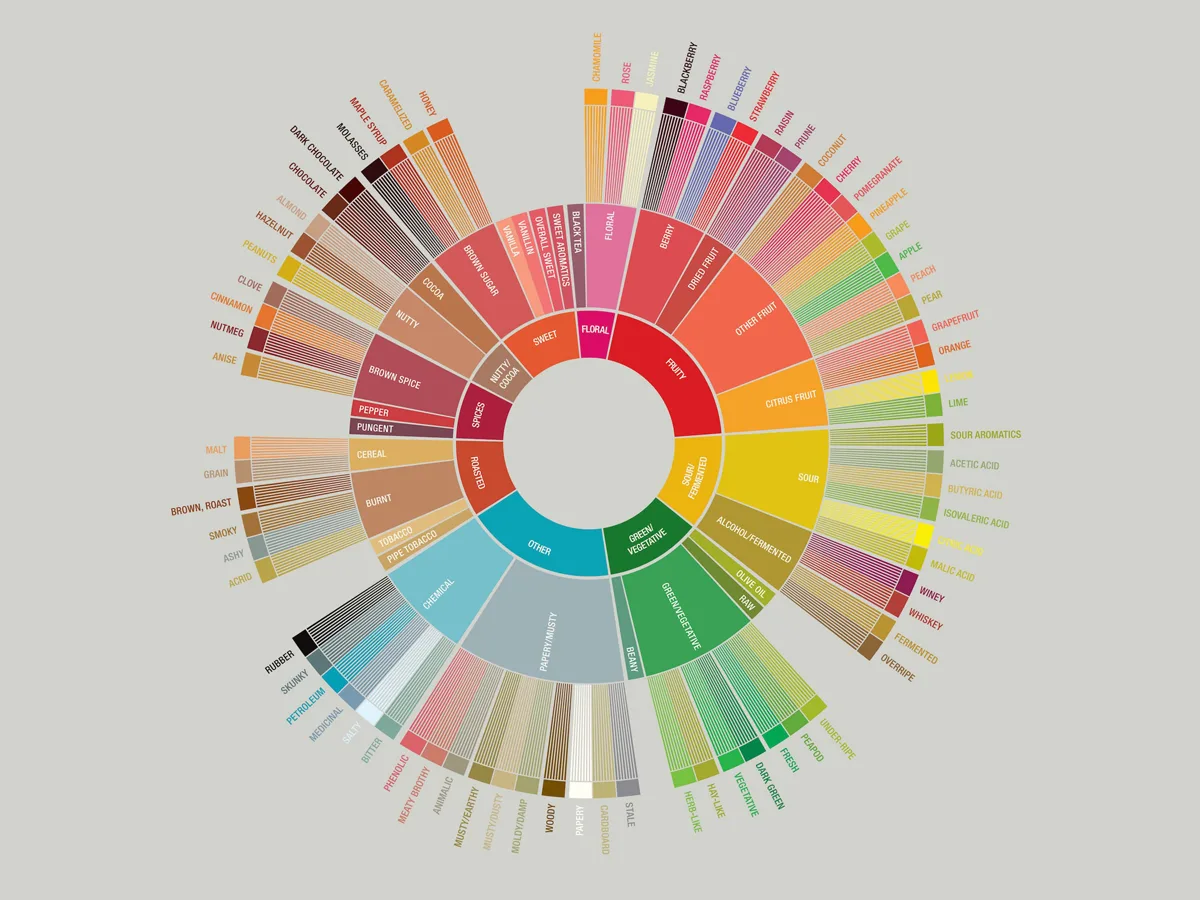
We cupped this 200-page report like a green bean—breaking out every layer of flavor: density, share, growth, unit economics—so you can blend decisions like a recipe.
#Which City Has the Highest Per-Capita Cafe Density?
Shanghai tops the list at 0.87 stores per 1,000 residents, followed by Beijing (0.62), Shenzhen (0.58), Chengdu (0.49), and Hangzhou (0.45). Chengdu's entry as the only non-first-tier city in the top five reflects the dual push of "special-forces coffee" tourism and social-driven consumption.

#Density Top-10 Comparison Table
| Rank | City | Stores/1k People | YoY Growth | Dominant Format |
|---|---|---|---|---|
| 1 | Shanghai | 0.87 | +12.3% | Chain + Specialty |
| 2 | Beijing | 0.62 | +9.8% | Chain-led |
| 3 | Shenzhen | 0.58 | +15.6% | Chain + Office Scene |
| 4 | Chengdu | 0.49 | +28.4% | Social + Signature Drinks |
| 5 | Hangzhou | 0.45 | +18.7% | Specialty + Lifestyle |
| 6 | Guangzhou | 0.41 | +11.2% | Traditional + New Fusion |
| 7 | Chongqing | 0.38 | +31.2% | Viral Check-in + Down-market |
| 8 | Nanjing | 0.35 | +16.5% | University + Business Dual Engine |
| 9 | Wuhan | 0.33 | +22.1% | Chain Down-market Acceleration |
| 10 | Xi'an | 0.31 | +25.8% | Tourism + Student Traffic |
Decision cue: Density ≠ opportunity. Chengdu, Chongqing, Xi'an grow >25% but median daily cups (280-310) lag Beijing/Shanghai/Shenzhen (350+). Site selection must combine the city-tier site-selection model (see closing section).
#Latest Market Shares: Luckin vs. Cotti vs. Starbucks
The big three chains hold 62.3% of chain outlets and 68.7% of chain revenue. Brand-level breakdown:
- Luckin Coffee: 18,300+ stores, 31.5% share, 420 cups/store/day, highest block efficiency
- Cotti Coffee: 12,500+ stores, 19.8% share, 380 cups/store/day, proven franchise model
- Starbucks China: 7,200+ stores, 11.0% share, 510 cups/store/day, deep moat via premium pricing
#Big Three Core Metrics Comparison
| Metric | Luckin | Cotti | Starbucks |
|---|---|---|---|
| Store Count | 18,300+ | 12,500+ | 7,200+ |
| Avg Daily Cups/Store | 420 | 380 | 510 |
| Avg Ticket (CNY) | 16.8 | 14.2 | 32.5 |
| Block Efficiency (CNY/㎡/mo) | 4,200 | 3,800 | 5,600 |
| Franchise Ratio | 42% | 98% | 0% |
| Core Strategy | Scale + Supply Chain | Franchise Virality + Extreme Value | Company-owned Brand Premium + Third Space |
Startup insight: Luckin's "scale for cost", Cotti's "franchise for speed", Starbucks' "experience for premium" form three distinct logics. Specialty entrants should target non-standard SKUs + emotional customization + community ops, not head-on commodity wars. See "Coffee Brand Business Cases: Six Benchmarks Decoded".
#New-Tier City Growth Ranking
The report defines "new tier" as 15 cities with 3-10M population and trillion-yuan GDP. Top five YoY growth:
- Chongqing +31.2% (down-market + viral check-ins)
- Xi'an +25.8% (tourism flow + university demographic)
- Chengdu +28.4% (highest lifestyle penetration)
- Changsha +24.6% (night economy + social media spread)
- Wuhan +22.1% (dual-core layout + university density)
#New-Tier City Coffee Development Matrix
| City Tier | Representative Cities | Core Traits | Suitable Formats |
|---|---|---|---|
| High Density / High Growth | Chengdu, Chongqing, Xi'an | Density >0.35, Growth >25% | Chain down-market + Specialty niche + Signature lab |
| High Density / Steady Growth | Hangzhou, Nanjing, Wuhan | Density >0.3, Growth 15-25% | Specialty deep-dive + Lifestyle hybrid + Community ops |
| Low Density / High Growth | Changsha, Zhengzhou, Qingdao | Density <0.3, Growth >20% | Chain first-mover + Specialty pilot + Down-market pre-position |
| Low Density / Steady Growth | Tianjin, Suzhou, Ningbo | Density <0.3, Growth <15% | Differentiated positioning + Stock mining + Cross-brand collabs |
Site-selection tip: High-density/high-growth cities suit a "specialty + signature" dual-brand matrix; low-density/high-growth cities prioritize chain commodities for mindshare, then add specialty flagships. See "China Coffee Market Trends: From 10K-Store Expansion to Specialty Awakening".
#Per-Capita Consumption vs. Global Benchmarks
Mainland China averages 0.11 kg/year—just 8.5% of the global 1.3 kg mean and far below mature markets:
- Finland 12.0 kg (world #1)
- Norway 9.9 kg
- Germany 6.5 kg
- USA 4.2 kg
- Japan 3.5 kg
- South Korea 2.8 kg
- Hong Kong SAR 1.8 kg
- Taiwan 1.5 kg
4.4 kg vs 0.1 kg—this isn't a gap, it's a trillion-yuan blue ocean quantified. Every pour-over, every cupping, every origin trace pushes that curve upward. Data details in "illy Report: Israelis 4.4 kg vs China 0.1 kg".
#How to Download the Report PDF for Free
Compliant download channels:
- Follow "CoffeeStyle" WeChat Official Account, reply "2024 City Coffee Report" for authorized link
- Visit
coffeestyle.cn/reports/2024-city-coffee, verify corporate email for direct access - Scan QR code at article end to join "Coffee Decision-Makers Community" for full PDF + Excel data pack
Package includes: Full PDF (218 pages), 10 high-res decision charts (PNG), 3 pitfall checklists, city-tier site-selection model (Excel), brand expansion trajectory dynamic map link.
#Three Startup Pitfall Checklists (Print & Post)
#Checklist 1: 20 Must-Checks Before Signing Lease
- Target trade area: <5 same-category stores within 300 m radius
- Morning rush (7-9 AM) footfall ≥200 people/15 min
- Rent ≤18% of projected monthly revenue (specialty ≤22%)
- Power/water/gas interfaces meet espresso/roaster specs
- Exhaust/drainage/fire acceptance feasibility confirmed
- Lease includes "change-of-use exemption" & "force majeure exit" clauses
- Property allows outdoor seating/signage/operations past 22:00
- Core staff commute ≤45 min
- No same-brand company store within 3 km (verify franchise protection radius)
- Landlord entity verified: no mortgage/seizure risks
#Checklist 2: 15 Equipment & Supply-Chain Traps
- Espresso machine: dual-boiler/heat-exchange matched to daily volume forecast
- Grinder: burrs ≥64 mm, stepless adjustment
- Water test: TDS 75-150 ppm, hardness 50-80 ppm, pH 6.5-7.5
- Green bean sourcing: dual suppliers, batch cupping SOP
- Roast standardization: Agtron ±3 tolerance, on-shelf within 48 h post-roast
- Milk/oat milk cold-chain backup plan (alt supplier + shelf-stable fallback)
- Syrup/fruit puree/alcohol shelf-life tracking ledger
- Cup/lid/straw eco-certification compliance
- Equipment SLA ≤4 h response, critical spares on-site
#Checklist 3: First 90 Days Operational Keys (30 Actions)
- Days 1-7: SOP rollout, team cupping calibration, mystery shopper audit
- Days 8-30: SKU rationalization (cut <5 cups/day items), lock golden ratio
- Days 31-60: Private domain build (WeCom/mini-program), loyalty launch, repeat-rate tracking
- Days 61-90: Community calendar (cuppings/pour-over classes/origin talks), UGC incentives
- Daily review: waste bean rate, ticket time, complaint response, cash-flow forecast
#City-Tier Site-Selection Model: From Data to Deployment
We distilled the report's city-level data into a four-quadrant decision matrix for founders, investors, and brand heads:
#Model Core Dimensions
- X-axis: Coffee Maturity Index = (stores/1k ×0.4 + annual frequency ×0.3 + specialty penetration ×0.3) normalized
- Y-axis: Growth Momentum = (store YoY ×0.5 + revenue YoY ×0.3 + new entrant count ×0.2) normalized
#Quadrant Strategy Mapping
| Quadrant | City Profile | Core Strategy | Typical Playbook |
|---|---|---|---|
| Q1 Mature High-Growth (High Maturity, High Growth) | Shanghai, Shenzhen, Chengdu | Micro-community specialty, signature lab, brand line extension | Single specialty store + central kitchen + subscription membership |
| Q2 Mature Low-Growth (High Maturity, Low Growth) | Beijing, Guangzhou, Hangzhou | Stock deepening, differentiation, cross-brand collabs, third-space ops | Flagship experience store + lifestyle merch + high-ticket private domain |
| Q3 Emerging High-Growth (Low Maturity, High Growth) | Chongqing, Xi'an, Changsha, Wuhan | Chain commodity first-mover, specialty flagship pilot, down-market pre-position | Chain matrix + 1-2 specialty flagships + supply-chain pre-position |
| Q4 Emerging Low-Growth (Low Maturity, Low Growth) | Tianjin, Suzhou, Ningbo, Qingdao | Differentiated survival, niche scenes (biz/tourism/campus), low-cost validation | Asset-light pop-ups + community group-buy + rapid test-learn |
How to use:
- Locate target city quadrant
- Adopt matched strategy bundle
- Execute against pitfall checklists
- Re-assess quadrant at 90-day review
This model isn't the destination—it's the starting grind. Like dialing extraction, every city, every mall, every corner demands you measure with footsteps, verify with palate, recalibrate with data.
#Closing: Finding Your Coordinates Between Data & Flavor
The report's last page leaves no answer—only a set of coordinates.
Shanghai dawn: Luckin riders weaving through office towers. Chengdu afternoon: pour-over steam rising in Kuanzhai Alleys. Chongqing night: signature drinks settling mountain-city mist at Guanyinqiao. Data shows where density, growth, and share live—but ritual, third space, emotional customization live beyond the numbers.
We deconstructed the report not so you'd copy-paste data into a lease, but so you can find your golden ratio where the flavor map overlaps the commercial map.
Next steps:
- Download the full report & data pack; build your city observatory
- Read "China Coffee Market Size 2024: Cross-Verified Data from 10+ Reports" for a ten-year horizon
- Join the CoffeeStyle decision-makers community to swap field notes
One cup, one life attitude. Bitterness ends in sweetness—begin underfoot.
#FAQ
#Which city has the highest per-capita cafe density?
Shanghai leads at 0.87 stores per 1,000 residents, followed by Beijing, Shenzhen, Chengdu, and Hangzhou. Chengdu's top-five entry as a non-first-tier city reflects lifestyle penetration and social-driven demand.
#What are the latest market shares for Luckin, Cotti, and Starbucks?
The big three hold 62.3% of chain outlets and 68.7% of chain revenue. Luckin: 18,300+ stores, 31.5% share. Cotti: 12,500+ stores, 19.8% share. Starbucks: 7,200+ stores, 11.0% share. Their unit models differ sharply: Luckin chases block efficiency, Cotti scales via franchise, Starbucks defends premium ticket and third-space moat.
#Which new-tier cities show the fastest coffee growth?
Chongqing (+31.2%), Xi'an (+25.8%), Chengdu (+28.4%), Changsha (+24.6%), Wuhan (+22.1%). Drivers vary: Chongqing—down-market + viral; Xi'an—tourism + students; Chengdu—lifestyle penetration; Changsha—night economy; Wuhan—dual-core layout + universities.
#How does China's per-capita coffee consumption compare globally?
Mainland China: 0.11 kg/year, only 8.5% of the 1.3 kg global average. Finland leads at 12 kg; Japan 3.5 kg, South Korea 2.8 kg, Hong Kong 1.8 kg, Taiwan 1.5 kg. The gap quantifies a trillion-yuan blue ocean; specialty culture awakening and consumption upgrade are the core growth logics.
#How can I get the 2024 China City Coffee Development Report PDF for free?
Follow "CoffeeStyle" WeChat Official Account and reply "2024 City Coffee Report", visit coffeestyle.cn/reports/2024-city-coffee with a corporate email, or scan the end-of-article QR code to join the community. All channels deliver the authorized PDF (218 pages), 10 decision charts, 3 checklists, site-selection Excel, and brand expansion dynamic map.



Comments