Coffee brand business case study: Six Benchmarks Decoded & the Scale vs Specialty Strategic Map
TL;DR: This article deconstructs six benchmark coffee brands — Luckin, Starbucks China, Cotti, Blue Bottle, % Arabica, and a local independent specialty shop — through a three‑dimensional radar of unit economics, organizational capability, and brand equity, delivering a practical diagnostic framework for founders, investors, and brand owners.
If coffee is a ritual of patience and anticipation, then a brand’s commercial evolution is the constant balance of that ritual between scale and specialty, standard and terroir. Legend tells of ninth‑century Ethiopian goatherd Kaldi, whose flock danced through the night after eating red cherries; monks brewed the fruit to sustain their prayers — and coffee awakened in myth. Today, from Luckin’s algorithmic ten‑thousand‑store engine to Blue Bottle’s single‑origin devotion, every brand writes its own “bitterness turning to sweetness” narrative. As seasoned coffee travelers, we invite you to traverse data and flavor, and glimpse the strategic coordinates behind every cup.
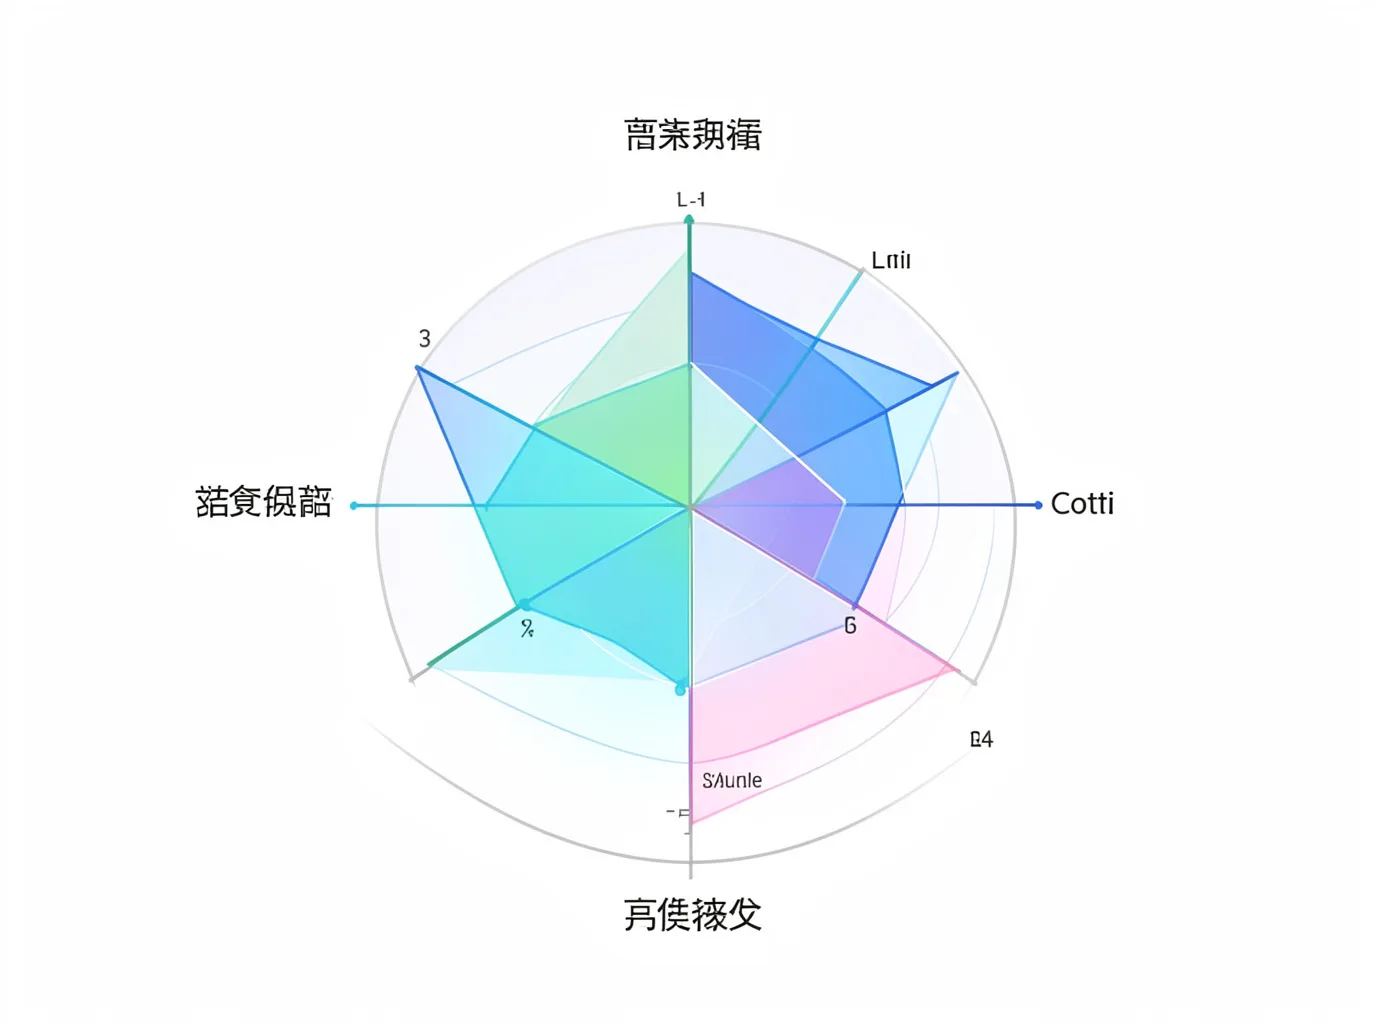
#Coffee brand business case study: Three‑Dimensional Radar of Six Benchmarks
We evaluate six representative brands on Unit Economics (store‑level ROI, revenue per sq m, turnover), Organizational Capability (supply‑chain control, digital ops, talent pipeline), and Brand Equity (mindshare, pricing power, community loyalty) on a 1‑5 relative scale. The table below shows qualitative scores; numbers are for relative comparison only.
| Brand | Unit Economics | Org Capability | Brand Equity |
|---|---|---|---|
| Luckin Coffee | 5 | 5 | 4 |
| Starbucks China | 4 | 5 | 5 |
| Cotti Coffee | 3 | 4 | 3 |
| Blue Bottle | 3 | 4 | 5 |
| % Arabica | 4 | 3 | 4 |
| Local Independent Specialty | 2 | 2 | 3 |
Interpretation: Luckin excels in both unit economics and org capability, ideal for hyper‑scale; Starbucks leverages brand equity and org strength for premium pricing; Blue Bottle’s brand equity sustains specialty margins despite modest unit economics; independents score low across the board and must differentiate on experience.
#What Is the Core Leverage of Luckin’s 10,000‑Store Model?
#1. Extreme Unit‑Economics Design
- Ultra‑lean SKU: ~30 core items, inventory turnover ≤ 7 days.
- High‑frequency low‑ticket: ¥9.9‑12 price band, > 55 % gross margin per cup, 300+ cups/day turnover to cover rent.
#2. Digital Operations Middleware
- C‑end mini‑program + B‑end SaaS: real‑time order, stock, labor data → “sell‑to‑make, make‑to‑buy”.
- Algorithmic site selection: POI heat, competitor density, rent threshold → “golden coordinates”.
#3. Vertically Integrated Supply Chain
- Own roasting factory: 100k t/yr capacity, cost ~ 70 % of industry average.
- Origin‑level contracts: long‑term agreements with Yunnan, Brazil, Ethiopia to lock green‑bean prices.
Reusable Action: Build a “Unit‑Economics Stress‑Test Sheet” (rent %, labor productivity, turnover, gross margin) and review quarterly.
#What Are the Key Moves in Starbucks China’s Localization?
#1. Product “Chinese Flavor” Iteration
- Tea‑coffee fusion: Jasmine cold brew, Longjing latte — aligning with local tea palate.
- Seasonal limited editions tied to the 24 solar terms (e.g., “Osmanthus Cold Brew for Beginning of Autumn”), creating ritualistic buzz.
#2. Third‑Space Micro‑Renovation
- Community store format: 150‑200 sq m “Starbucks Reserve” with co‑working power outlets, meeting‑room booking.
- Local heritage decor: paper‑cutting, Suzhou embroidery elements to deepen cultural resonance.
#3. Deepened Digital Loyalty
- Star Rewards: points redeemable for merch, tree‑planting CSR, reinforcing emotional connection.
- Enterprise WeChat private domain: store managers nurture 500‑800 high‑value guests, lifting conversion ~ 12 %.
Reference: China Coffee Market Size 2024: Cross‑Verified Data from 10+ Reports, 10K‑Store Brand Tipping Point & Investment Outlook provides macro context on market size and the 10k‑store tipping point.
#Can Cotti’s ¥9.9 Price Point Sustain a Viable Unit Model?
#Unit‑Economics Stress Test
| Metric | Assumed Value | Break‑Even Threshold |
|---|---|---|
| Daily cups | 250 | ≥ 200 |
| Avg price | ¥9.9 | — |
| Gross margin per cup | 45 % | ≥ 40 % |
| Rent / revenue | 18 % | ≤ 20 % |
| Labor productivity (cups/person/day) | 80 | ≥ 70 |
Verdict: Viable in tier‑3/4 city prime locations with rent ≤ ¥12/sq m/day and avg wage ≤ ¥4,500; in tier‑1 cores requires delivery uplift or joint‑venture light‑asset model.
#Org Capability Gaps
- No proprietary roasting → reliance on third‑party toll roasters, quality variance.
- Digital middleware still building → 24‑hour data lag hampers rapid iteration.
Recommendation: Deploy a “Weekly Store Health Dashboard” tracking gross margin, turnover, and average ticket.
#How Has Blue Bottle’s Brand Power Shifted Post‑Nestlé Acquisition?
#Dual Effect on Brand Equity
- Positive — Global distribution network accelerates store rollout (5 → 15 new stores/yr).
- Negative — Core enthusiasts perceive “commercial dilution”; social‑listening NPS down ~ 3 pp.
#Organizational Integration
- Shared roasting hub: Nestlé’s Swiss roasting center delivers ±0.5 % Agtron consistency.
- Talent infusion: Nestlé supply‑chain execs appointed COO, lean production lifts labor productivity 8 %.
#Strategic Map Position
- Specialty axis: Keeps single‑origin, light‑roast, pour‑over core (¥45‑55/cup).
- Scale axis: Launches RTD canned line entering mass retail.
Reference: Coffee Shop Business Plan: From Site Selection to Financial Model helps model the margin trade‑off between specialty and scale.
#How Can Independent Specialty Shops Differentiate Against Chains?
#1. Deep Origin Traceability
- Micro‑lot direct contracts with farms in Baoshan (Yunnan) and Minas Gerais (Brazil) for exclusive lots.
- Public cupping scores: Monthly SCA scorecards displayed in‑store, inviting guests to cup alongside baristas.
#2. Ritual‑Driven Space Design
- Slow‑brew corner (V60, siphon, cold drip) offering 30‑minute dedicated brew service.
- Heritage collaborations: limited‑edition cup sleeves with local intangible‑cultural‑heritage artisans, “Tea Horse Road” signature drinks.
#3. Private‑Community Operations
- Subscription club: ¥199/mo for “Bean of the Week” delivery + priority tasting events.
- Co‑created content: Guests upload brew logs; curated into a “Flavor Map” mini‑program column.
Tool Tip: Use the “Golden Ratio Brew Calculator” (1:15.5 coffee‑water, 92 °C, 2:30 extraction) to standardize pour‑over consistency.
#Strategic Map: Scale vs. Specialty Decision Framework
Project the three‑dimensional radar onto a 2‑D plane:
- X‑axis: Unit Economics score (scale potential)
- Y‑axis: Brand Equity score (specialty premium)
| Quadrant | Typical Brands | Strategic Guidance |
|---|---|---|
| High X, Low Y | Luckin, Cotti | Keep driving unit‑cost down, replicate fast; modestly invest in brand to defend price war. |
| High X, High Y | Starbucks China | Dual‑engine: flagship stores keep premium, satellite stores adopt light model. |
| Low X, High Y | Blue Bottle, % Arabica | Guard specialty mindshare, expand cautiously; explore RTD / capsule for revenue diversification. |
| Low X, Low Y | Independent specialty | Hyper‑focus on micro‑trade area, craft irreplaceable experience, avoid head‑on chain competition. |
Next Step: Download the “Coffee Brand Diagnostic Toolkit” (radar template, unit‑economics stress sheet, brand‑equity scorecard) and run a quarterly self‑audit.
#Closing: Finding Your Emotional Customization in Bitterness‑Turned‑Sweetness
From Kaldi’s red‑cherry legend to Luckin’s algorithmic site selection and Blue Bottle’s single‑origin devotion, coffee’s commercial history has always been a dynamic equilibrium between “standardization and terroir, scale and ritual.” There is no absolute superiority — only whether you have found your own coordinates. When you adjust water to 92 °C and a 1:15.5 ratio for a midnight pour‑over, or tap a ¥9.9 Flat White on your phone at dawn, that choice is your vote for a life attitude. May every founder, investor, and brand steward distill their own “bitterness turning to sweetness” between data’s rationality and flavor’s sensibility — completing a perfect extraction of emotional customization.
#FAQ
#What is the core leverage of Luckin’s 10,000‑store model?
The leverage sits in a triad: an ultra‑lean SKU lineup for high turnover, a digital middleware that turns real‑time sales into production and procurement signals, and a vertically integrated roasting factory that locks in green‑bean costs.
#What are the key actions in Starbucks China’s localization?
Starbucks localized through tea‑coffee seasonal drinks, community‑store redesigns that add co‑working amenities and local heritage decor, and a deepened loyalty program powered by Enterprise WeChat private‑domain management.
#Can Cotti’s ¥9.9 price sustain a viable store model?
Yes in lower‑tier cities where rent ≤ ¥12/sq m/day and labor ≤ ¥4,500/month; in tier‑1 cores the model needs delivery volume or a joint‑venture light‑asset format to stay profitable.
#How has Blue Bottle’s brand power changed after Nestlé’s acquisition?
Global rollout accelerated and roasting consistency improved via Nestlé’s Swiss hub, but core enthusiasts sense commercial dilution, causing a slight NPS dip; the brand now balances specialty credibility with a new RTD mass‑market line.
#How can independent specialty shops differentiate from chains?
By securing exclusive micro‑lot origins, publishing transparent cupping scores, designing ritual‑centric slow‑brew spaces, collaborating with local intangible heritage, and building a subscription‑based private community with co‑created content.