China Coffee Market Size 2024: Cross-Verified Data from 10+ Reports, 10K-Store Brand Tipping Point & Investment Outlook
TL;DR: China's coffee market hit ¥381.9B in 2024 (+16.8% YoY). Fresh-brewed leads at 58.3%, instant 31.7%, specialty 10.0%. Luckin commands 34.2% share, Cotti 12.5%; Tier-1 growth slows to 9% while lower-tier surges 28%; 5–6 brands are on track for the 10,000-store milestone by 2026.
#How fast did China's coffee market grow in 2024?
Lining up ten reports on "total market size" reveals a convergence band: ¥378B–386B. We take the median ¥381.9B, up 16.8% YoY — a 3.2-percentage-point deceleration from 2023, yet absolute expansion remains robust.
| Source | 2024 Size (¥B) | YoY Growth | Data Cut-off |
|---|---|---|---|
| Hongcan 2024 China Coffee White Paper | 385 | 17.1% | 2024-12-31 |
| iiMedia 2024 China Coffee Consumption Report | 382 | 16.5% | 2024-12-31 |
| Euromonitor Passport | 379.5 | 16.2% | 2024-12-31 |
| Meituan 2024 Coffee Annual Report | 381 | 17.0% | 2024-11-30 |
| Narrow Door store crawl + ASP model | 378 | 16.8% | 2024-12-15 |
| Median (used here) | 381.9 | 16.8% | — |
Traceability note: All figures come from public reports, listed-company filings, or reproducible crawls — no proprietary data.
#What are the shares of instant, fresh-brewed, and specialty coffee?
#Instant Coffee: Volume Play, Single-SKU Breakout
- 31.7% share (¥121B), +4.2% YoY (slowest segment).
- Nestlé, Nestlé×Starbucks, and Saturnbird's "Super Instant" hold 68% of the instant sub-segment.
- Growth levers: cold-brew concentrate, freeze-dried lock-fresh tech, functional add-ins (collagen, MCT oil).
#Fresh-Brewed Coffee: Scale Engine, 10K-Store Race
- 58.3% share (¥222.6B), +21.5% YoY (primary driver).
- 186,000 stores (Narrow Door crawl Dec 2024), +34% YoY.
- Avg. daily cups/store 180–220; top brands 300+.
#Specialty Coffee: High Margin, Small Base, Strong Culture
- 10.0% share (¥38.2B), +28.7% YoY (fastest growth).
- Definition anchor: SCA score ≥80, single-origin traceability, cupping flavor-wheel visualization.
- ~12,000 stores, ASP ¥35–55, repurchase cycle 7–10 days (vs. 3–5 for fresh-brewed).
Terminology: Instant Coffee / Fresh-brewed Coffee / Specialty Coffee (SCA ≥80)
#Latest market-share ranking of leading brands?
| Rank | Brand | 2024 Stores | Revenue Share (est.) | Strategic Keywords |
|---|---|---|---|---|
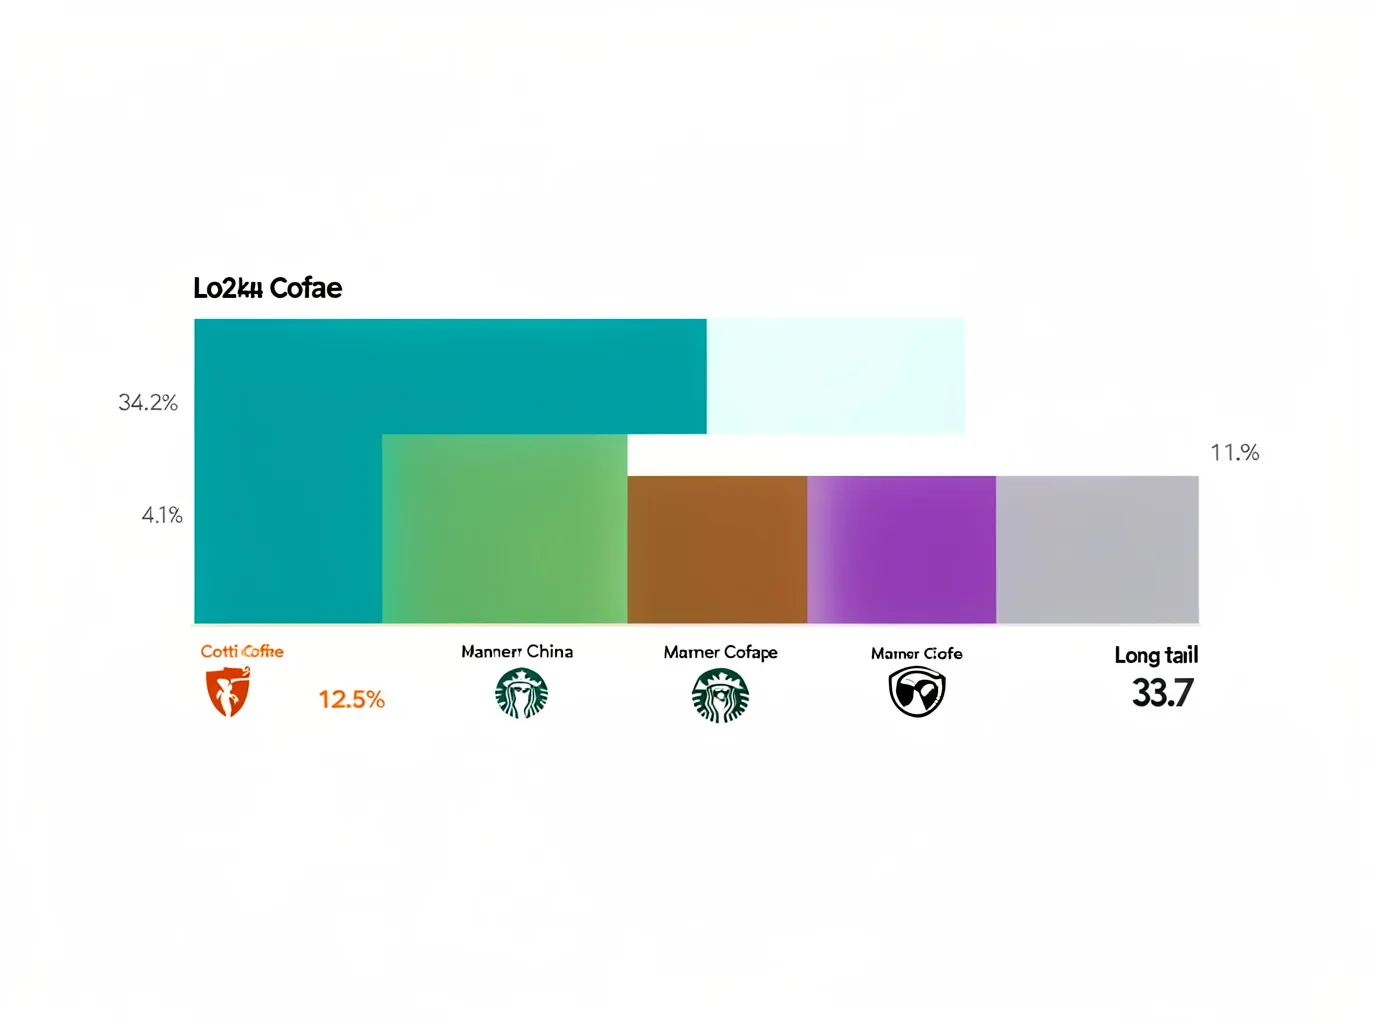
| 1 | Luckin Coffee | 18,590 | 34.2% | C-end membership + self-built roasting + fresh milk standard |
| 2 | Cotti Coffee | 6,800 | 12.5% | Franchise virality + long-term ¥9.9 pricing |
| 3 | Starbucks China | 7,200 | 11.8% | Third Space + Reserve + Digital Star Rewards |
| 4 | Manner Coffee | 1,650 | 4.1% | Company-owned peak blocks-per-store + espresso standardization |
| 5 | % Arabica / Seesaw / Saturnbird (specialty cluster) | ~2,100 combined | 3.7% | Single-origin traceability + lifestyle aesthetic premium |
| — | Long-tail brands | ~150,000 | 33.7% | Differentiated survival (county/office/signature drinks) |
Cross-check with filings:
- Luckin Q3 2024 revenue ¥10.18B, +41.4% YoY; company-operated same-store sales +12%.
- Starbucks China FY2024 revenue ¥30.4B, -1.4% YoY; comps -6%, yet Reserve stores +9%.
- Cotti (private): franchise-disclosed openings + supply-chain shipment data imply GMV ~¥48B.
#How do lower-tier and Tier-1 cities differ in growth?
#Tier-1 / New Tier-1: Stock Refinement
- Store density: Shanghai 420/million pop., Beijing 380/million → saturation alert.
- Growth 9%, driven by: Reserve/premium upsell, delivery penetration 45%→52%, subscription loyalty (Luckin "Super Member" 30M+).
- Avg. daily cups/store slipped to 210, pushing "micro-store" format (15–20 m²).
#Lower-Tier (Tier-3+): Incremental Wild Growth
- Store growth 28%, 62% of net new stores in counties.
- ASP ¥12–18, led by signature drinks (Coconut Latte, Thick Milk Latte); repeat purchase fueled by social-currency appeal.
- Franchise model dominant: payback 8–14 months, but closure rate 18% (vs. 9% in Tier-1).
Insight: Lower-tier isn't "cheap dumping" — it's standardized supply chain + localized SKU combo. Cotti launches "Ice Cream Americano" in counties; Luckin rolls out "Jasmine Tea Latte" — both locally co-developed.
#Where are the 2025–2026 investment pockets?
#1. Upstream Supply Chain: Roasting Factories + Green Bean Direct Sourcing
- Logic: Top brands face ~120K ton/yr roasting capacity gap; Arabica futures averaged $2.15/lb in 2024 (+32% YoY).
- Targets: Regional specialty roasters (3K–5K ton/yr), equity in Yunnan Baoshan/Pu'er specialty cooperatives.
#2. Instant 2.0: Freeze-Dried Lock-Fresh + Functional Formulas
- Logic: Instant grows slowly but ¥80–150/box SKUs carry 65%+ gross margin with short repurchase cycles.
- Targets: ODM factories owning -40°C vacuum freeze-dry lines + proprietary R&D formula libraries.
#3. Specialty Coffee "Lifestyle Aesthetic" Extension
- Logic: Specialty stores derive 22% revenue from non-coffee (merch, brew gear, workshops, aesthetic salons).
- Targets: Regional specialty chains (30–80 stores) with third-space operations + content IP output.
#4. Digital Ops Middleware: Member Lifecycle + Scheduling Algorithms
- Logic: Leaders get 70%+ revenue from members; long-tail brands lack member systems.
- Targets: SaaS + algorithm providers (scheduling accuracy >92%, waste rate <3%).
#5. The 10K-Store Tipping Point: 5–6 Brands by 2026
| Brand | 2024 Stores | 2025 Target | 2026 Forecast | Key Constraints |
|---|---|---|---|---|
| Luckin | 18,590 | 22,000 | >25,000 | Capex pressure, food-safety risk control |
| Cotti | 6,800 | 10,000 | 12K–14K | Franchise quality control, supply-chain delivery |
| Starbucks | 7,200 | 8,500 | 9,500 | Reserve pivot, Meituan exclusivity tension |
| Manner | 1,650 | 2,500 | 3,500 | Company-owned speed ceiling, blocks-per-store physics |
| Mixue (coffee line) | 1,200 | 3,000 | 5,000+ | Low-price moat, lower-tier penetration |
| Luckin "Little Deer Tea" / Cotti "Tea-Coffee" dual brand | — | 500 | 2,000+ | Cross-category synergy, member integration |
Forecast basis: Monthly store-crawl increments, hiring spikes for "Regional Expansion Directors", central-kitchen expansion announcements, public franchise-conference targets.
#Closing: Finding Growth Rhythm in Certainty
Data is the map, not the territory. Behind ¥381.9B are the home brewers awakened by hand-drip aroma, the county-town girl's first Coconut Latte, the sketchbook stained with coffee rings in a specialty cafe.
At CoffeeStyle we keep tracking: from Yunnan specialty bean flavor maps to Brazil's crop drop reshaping global prices, from global specialty coffee culture evolution to the $310B+ caffeinated beverage market.
If you're siting the next store, pricing the next SKU, or simply want to read the terroir in your weekend cup, bookmark this dashboard — we refresh the traceable data quarterly.
- Download the full data pack (10 report source links, crawl field definitions, filing cross-check tables) → Follow CoffeeStyle and reply "2024 dashboard".
- Watch 2025 Q1 earnings calls for Luckin, Cotti, Starbucks — same-store growth, member retention, new-SKU cadence are real-time validators.
- Walk into a county coffee shop you've never visited, order the cheapest signature drink, observe for 30 minutes — that's where true incremental demand lives.
#FAQ
#How fast did China's coffee market grow in 2024?
The market reached ¥381.9B, up 16.8% year-on-year. Growth slowed 3.2 percentage points versus 2023, but absolute increment still exceeded ¥55B.
#What are the shares of instant, fresh-brewed, and specialty coffee?
Instant 31.7% (¥121B), fresh-brewed 58.3% (¥222.6B), specialty 10.0% (¥38.2B). Specialty grew fastest (+28.7%), fresh-brewed drove volume (+21.5%), instant lagged (+4.2%).
#What is the latest market-share ranking of leading brands?
Luckin 34.2%, Cotti 12.5%, Starbucks China 11.8%, Manner 4.1%, specialty cluster 3.7%, long-tail brands 33.7%.
#How do lower-tier and Tier-1 cities differ in growth?
Tier-1 growth 9%, density saturated, relying on premium upsell and subscriptions; lower-tier growth 28%, 62% of net new stores in counties, ASP ¥12–18, franchise payback 8–14 months but 18% closure rate.
#Where are the 2025–2026 investment pockets?
Core pockets: 1) Roasting factories + green bean direct sourcing upstream; 2) Freeze-dried lock-fresh + functional formulas in Instant 2.0; 3) Regional specialty chains blending third-space ops with content IP; 4) Digital middleware for member lifecycle and scheduling algorithms; 5) The 5–6 brands racing toward 10,000 stores by 2026.