
Coffee Origin Flavor Map: 30 Core Regions × 6-D Radar × 3 Processes Interactive Guide
TL;DR: CoffeeStyle launches an interactive map of 30 core coffee origins with 6-dimension flavor radars, three processing-method overlays, and click-to-reveal golden roast curves plus brew specs. Covers Yirgacheffe vs Sidamo, Brazil keyword matrix, altitude-driven flavor shifts, process impact quantification, and a printable 300 DPI SVG download.
#Coffee Origin Flavor Map: Why We Need an Interactive Atlas
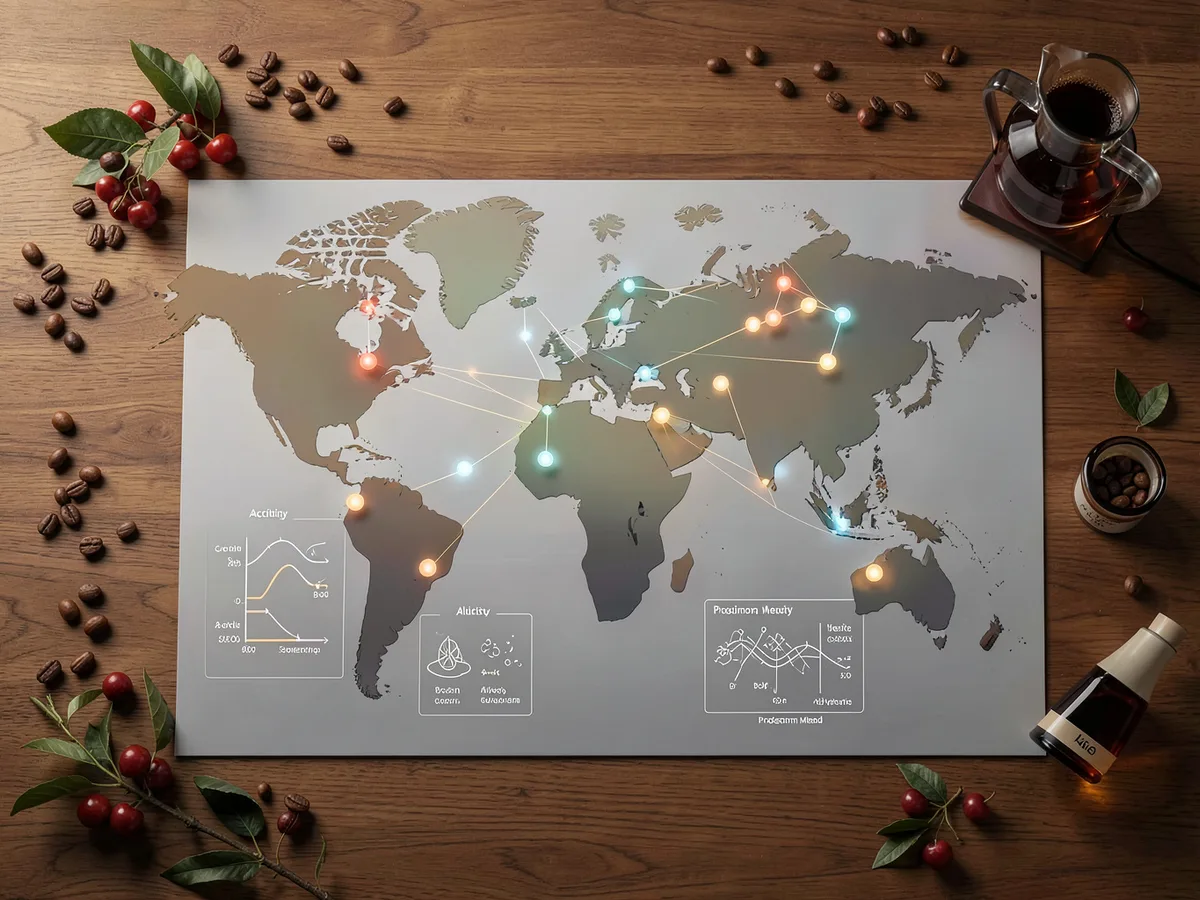
A cup of coffee, a way of life. As you pour 93 °C water over a V60 bed and watch the bloom unfurl, what rises is not merely jasmine citrus or nutty caramel—it is a terroir narrative that crosses the equator. The CoffeeStyle team has trekked from the Ethiopian highlands to Brazil’s Cerrado, distilling SCA cupping scores, roasters’ golden curves, and brewers’ extraction parameters into this coffee origin flavor map. It is no static poster; it is a living SVG: hover for a 6-axis radar (floral, fruit acidity, sweetness, body, aftertaste, balance), click for that origin’s light/medium/dark roast curves—rate of rise, development time ratio, first-crack end temp—and recommended V60, AeroPress, and espresso recipes with dose, ratio, temperature, and time.
#Yirgacheffe vs Sidamo: How to Separate Them on the Flavor Coordinate System
Ethiopia is coffee’s birthplace and its most confusing origin. Yirgacheffe’s core zones sit at 1,900–2,200 m, dominated by washed processing; its radar shows high floral (jasmine, lemon blossom), high fruit acidity (citrus, lime), medium sweetness, low body, typically cupping 88–91. Sidamo spans wider, 1,600–2,100 m, with both natural and washed lots: naturals radar high sweetness (berry, tropical fruit), medium-high body, medium acidity; washed lots approach Yirgacheffe but with softer florals and stronger tea-like clarity.
#Three-Step Field Separation
- Check process label: washed → lean Yirgacheffe; natural → lean Sidamo.
- Compare radars: Yirgacheffe floral axis > 7.5/10; Sidamo natural sweetness axis > 7/10.
- Cup to confirm: Yirgacheffe hits jasmine on the nose; Sidamo natural finishes like red wine.
Internal tool: Coffee Origin Flavor Profile Chart: A Four-Dimensional Matrix for Global Terroir offers a 20-origin four-dimensional matrix to pair with this map.
#Brazil Flavor Keywords: From Cerrado to Mogiana’s Nut-Caramel Spectrum
Brazil, the world’s largest producer, is often reduced to “nuts, chocolate, low acid.” Reality is richer. Cerrado (900–1,100 m, pulped natural dominant) radar shows high sweetness (caramel, milk chocolate), high body, near-zero acidity—ideal medium-dark base for blends. Mogiana (1,000–1,200 m, washed heavy) adds hazelnut, brown sugar, gentle citrus, shining as a light-roast single-origin pour-over. Sul de Minas microclimates allow Yellow Bourbon washed lots to express white peach, honey, bright lemon acid, cupping 86+.
#Brazil Three Core Regions Flavor Comparison
| Region | Altitude | Main Process | Core Keywords | Roast Level | Best Use |
|---|---|---|---|---|---|
| Cerrado | 900–1,100 m | Pulped natural / Natural | Caramel, milk chocolate, nut, low acid | Medium-dark | Espresso blend base, milk drinks |
| Mogiana | 1,000–1,200 m | Washed / Pulped natural | Hazelnut, brown sugar, soft citrus, medium body | Medium-light | Pour-over single, cold brew |
| Sul de Minas | 1,100–1,300 m | Washed / Natural | White peach, honey, lemon acid, floral | Light | Specialty pour-over, cupping |
#Altitude: How Flavor Shifts Every 100 Meters
Altitude is flavor’s invisible sculptor. Each 100 m rise drops temperature ~0.6 °C, extending cherry maturation 3–5 days, deepening sugar accumulation and acid complexity. Observed shifts:
- Below 1,000 m: fruit acidity < 4/10; sweetness caramel/nut; heavy body.
- 1,000–1,500 m: acidity 5–6/10; citrus/apple notes; honey/brown sugar sweetness.
- 1,500–2,000 m: acidity 7–8/10; floral axis spikes (jasmine, gardenia); refined cane-sugar sweetness.
- Above 2,000 m: acidity 8.5+/10; tea-like transparency; extreme aftertaste; tiny yields, high risk.
Field case: Colombia Huila 1,800 m washed Caturra scored floral 8.2, acidity 8.5; same variety at 1,400 m scored 6.5 and 6.8. The altitude gap is plain on the radar.
#Processing (Natural / Washed / Honey): The Flavor Rewriting Logic
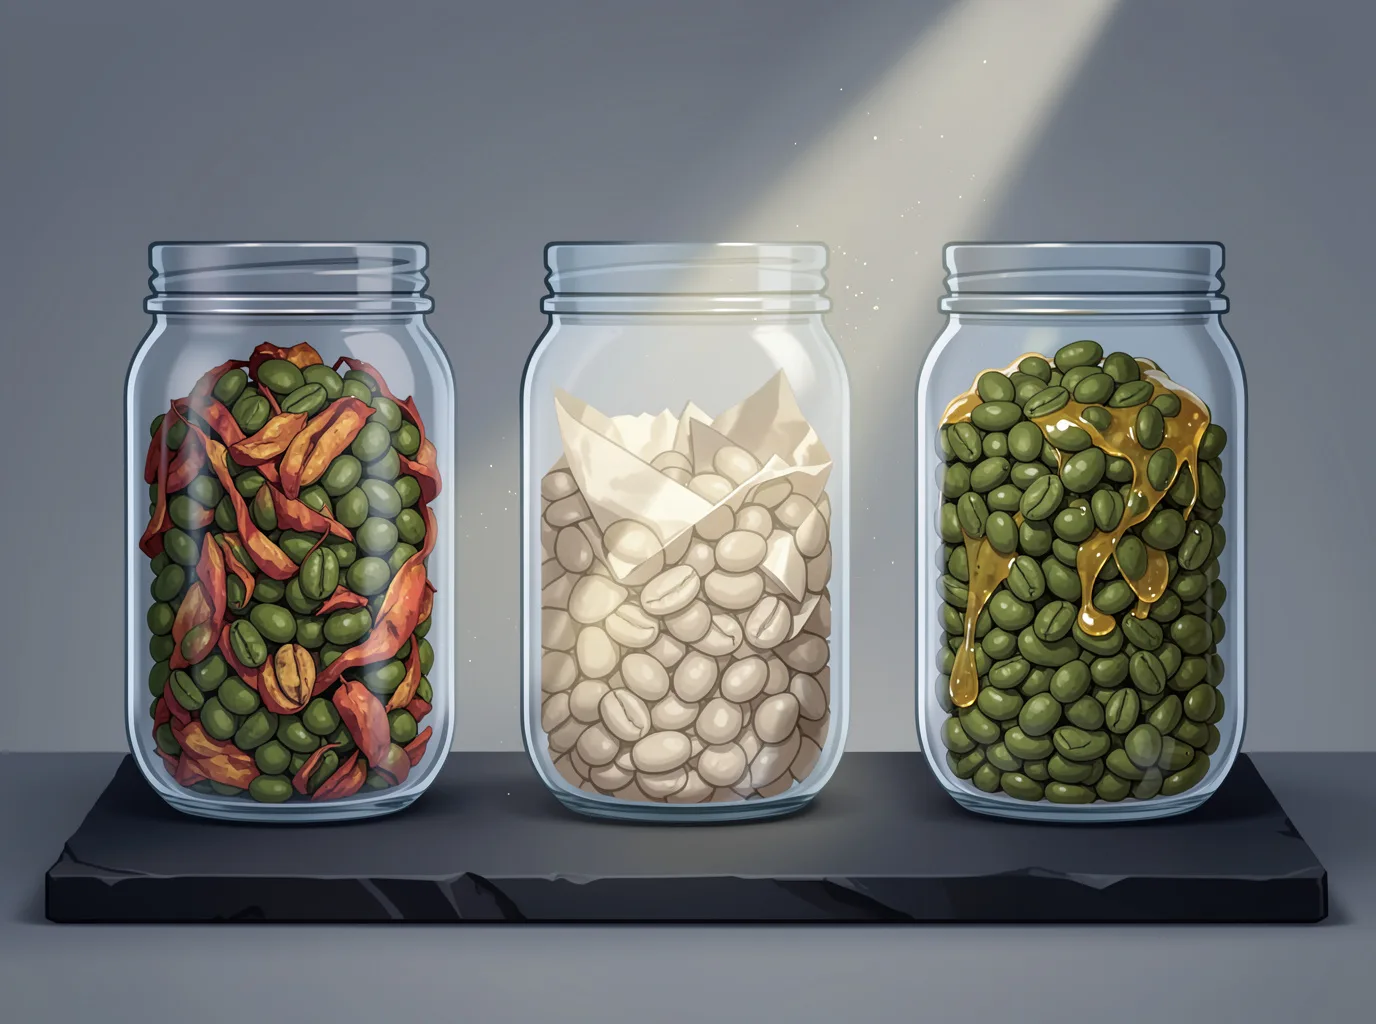
Processing is flavor’s “post-birth stylist.” The same lot, three ways, yields three distinct radar silhouettes:
#Natural — Whole-Fruit Fermentation
Whole cherries sun-dry 15–25 days; mucilage sugars migrate into the seed. Radar signature: sweetness +1.5–2.0, body +1.0, acidity –0.5 to –1.0, ferment notes (wine, tropical, boozy) appear. Suits lovers of weight, but demands strict water-activity control.
#Washed — Mucilage Removal for Purity
Mechanical depulping, 12–36 hr fermentation tank wash. Radar signature: floral +1.0, acidity +0.5–1.0, highest clarity, body –0.5. Best reveals terroir and variety; highest cupping consistency.
#Honey — Mucilage-Retained Balance
Depulped, varying mucilage retained (yellow/red/black honey). Radar signature: sweetness +1.0, body +0.5, acidity between natural/washed, caramel/honey notes prominent. Black honey nears natural sweetness; yellow honey nears washed clarity.
#Quantitative Radar Comparison (Ethiopia Heirloom Example)
| Axis | Washed | Yellow Honey | Red Honey | Black Honey | Natural |
|---|---|---|---|---|---|
| Floral | 8.5 | 7.8 | 7.2 | 6.5 | 5.8 |
| Fruit Acidity | 8.2 | 7.5 | 6.8 | 6.0 | 5.2 |
| Sweetness | 6.0 | 7.2 | 8.0 | 8.8 | 9.2 |
| Body | 5.5 | 6.2 | 7.0 | 7.8 | 8.5 |
| Aftertaste | 7.8 | 8.0 | 8.2 | 8.5 | 8.0 |
| Balance | 8.5 | 8.2 | 8.0 | 7.5 | 7.0 |
#Interactive SVG Map: Grab Golden Roast Curves & Brew Specs
Open Coffee Flavors by Region: A Flavor Coordinate Map of 20 Core Origins and you’ll find:
- World base map with 30 glowing origin pins, color-coded by dominant flavor bias (warm = sweet/body, cool = floral/acidity).
- Click any pin for a side panel with:
- 6-axis radar (toggle washed/natural/honey overlays)
- Golden roast curve: three-phase RoR targets, first-crack end temp, development time ratio, drop temp
- Brew recipe table: V60 (1:15.5, 92 °C, three-pour), AeroPress (standard/inverted), Espresso (18 g in, 36 g out, 25–30 s)
- Top-right “Download HD SVG” exports 300 DPI vector for A3 print or design reuse.
Companion piece: Coffee Origin Flavor Profile Chart: Download, Print & Buy Beans with Confidence delivers an A4 double-sided cheat sheet with mini SCA wheel and extraction-yield formula.
#From Flavor Map to Mood Design: Your Next Cup Starts Here
The map is not the destination; it’s the launchpad. When you pick a Panama Gesha washed guided by the radar, roast to its golden curve at 1:45 development, brew at 92 °C in three pours, and watch the refractometer read 1.38 % TDS / 20.2 % extraction—you taste not just jasmine and lemon, but a tribute to patience and precision. CoffeeStyle believes every radar, every curve, every recipe exists so you can hit pause in your third space and complete a mood design.
#Three Micro-Actions for This Weekend
- Open the interactive map, click your most-curious origin, save its golden roast curve.
- Download the HD SVG or A4 cheat sheet; tape it above your roaster or brew bar.
- Brew to the specs, log the flavor coordinates, share with #CoffeeStyleFlavorMap.
#FAQ
#How do I tell Yirgacheffe from Sidamo?
Yirgacheffe’s core zones are higher, washed-dominant, yielding jasmine floral, citrus acidity, tea-like clarity. Sidamo covers wider altitudes, more naturals; naturals show berry sweetness, winey body, while washed lots mimic Yirgacheffe with softer florals and stronger tea character. Check the process label, compare radar floral vs sweetness axes, and cup for entry aroma.
#What are Brazil’s flavor keywords?
Cerrado: caramel, milk chocolate, nut, low acid—medium-dark blend base. Mogiana: hazelnut, brown sugar, soft citrus—medium-light pour-over. Sul de Minas: white peach, honey, lemon acid, floral—light roast cupping 86+.
#How does flavor change per 100 m altitude gain?
Each 100 m cools ~0.6 °C, extending maturation 3–5 days. Below 1,000 m: caramel/nut, low acid. 1,000–1,500 m: citrus/apple acid, honey sweetness. 1,500–2,000 m: floral spike, refined sugar. Above 2,000 m: tea-like transparency, marathon aftertaste, minuscule yield.
#How do processing methods (natural/washed/honey) affect flavor?
Natural: whole-fruit fermentation → highest sweetness/body, lowest acid, winey ferment notes. Washed: mucilage removed → highest floral/acidity, cleanest cup, lowest body. Honey: partial mucilage retained → sweetness/body between the two, caramel/honey notes; yellow honey near washed, black honey near natural.
#Is there a downloadable high-res map?
Yes. The interactive map’s top-right “Download HD SVG” button exports a 300 DPI vector for lossless A3 printing. The companion Coffee Origin Flavor Profile Chart: Download, Print & Buy Beans with Confidence provides an A4 double-sided printable with mini SCA wheel and extraction-yield formula—perfect for wall reference or pocket carry.
Further reading: Global Coffee Origins: Mexico explores another origin’s terroir-story through the same radar lens.



Comments